3. Manage and monitor your first instance
In this chapter you will learn how to monitor the UMH on your device
2 minute read
Requirements:
- Management Console Downloaded & Installed
- Logged Into Your Account
- A Local Instance of the UMH instance
Manage your instance
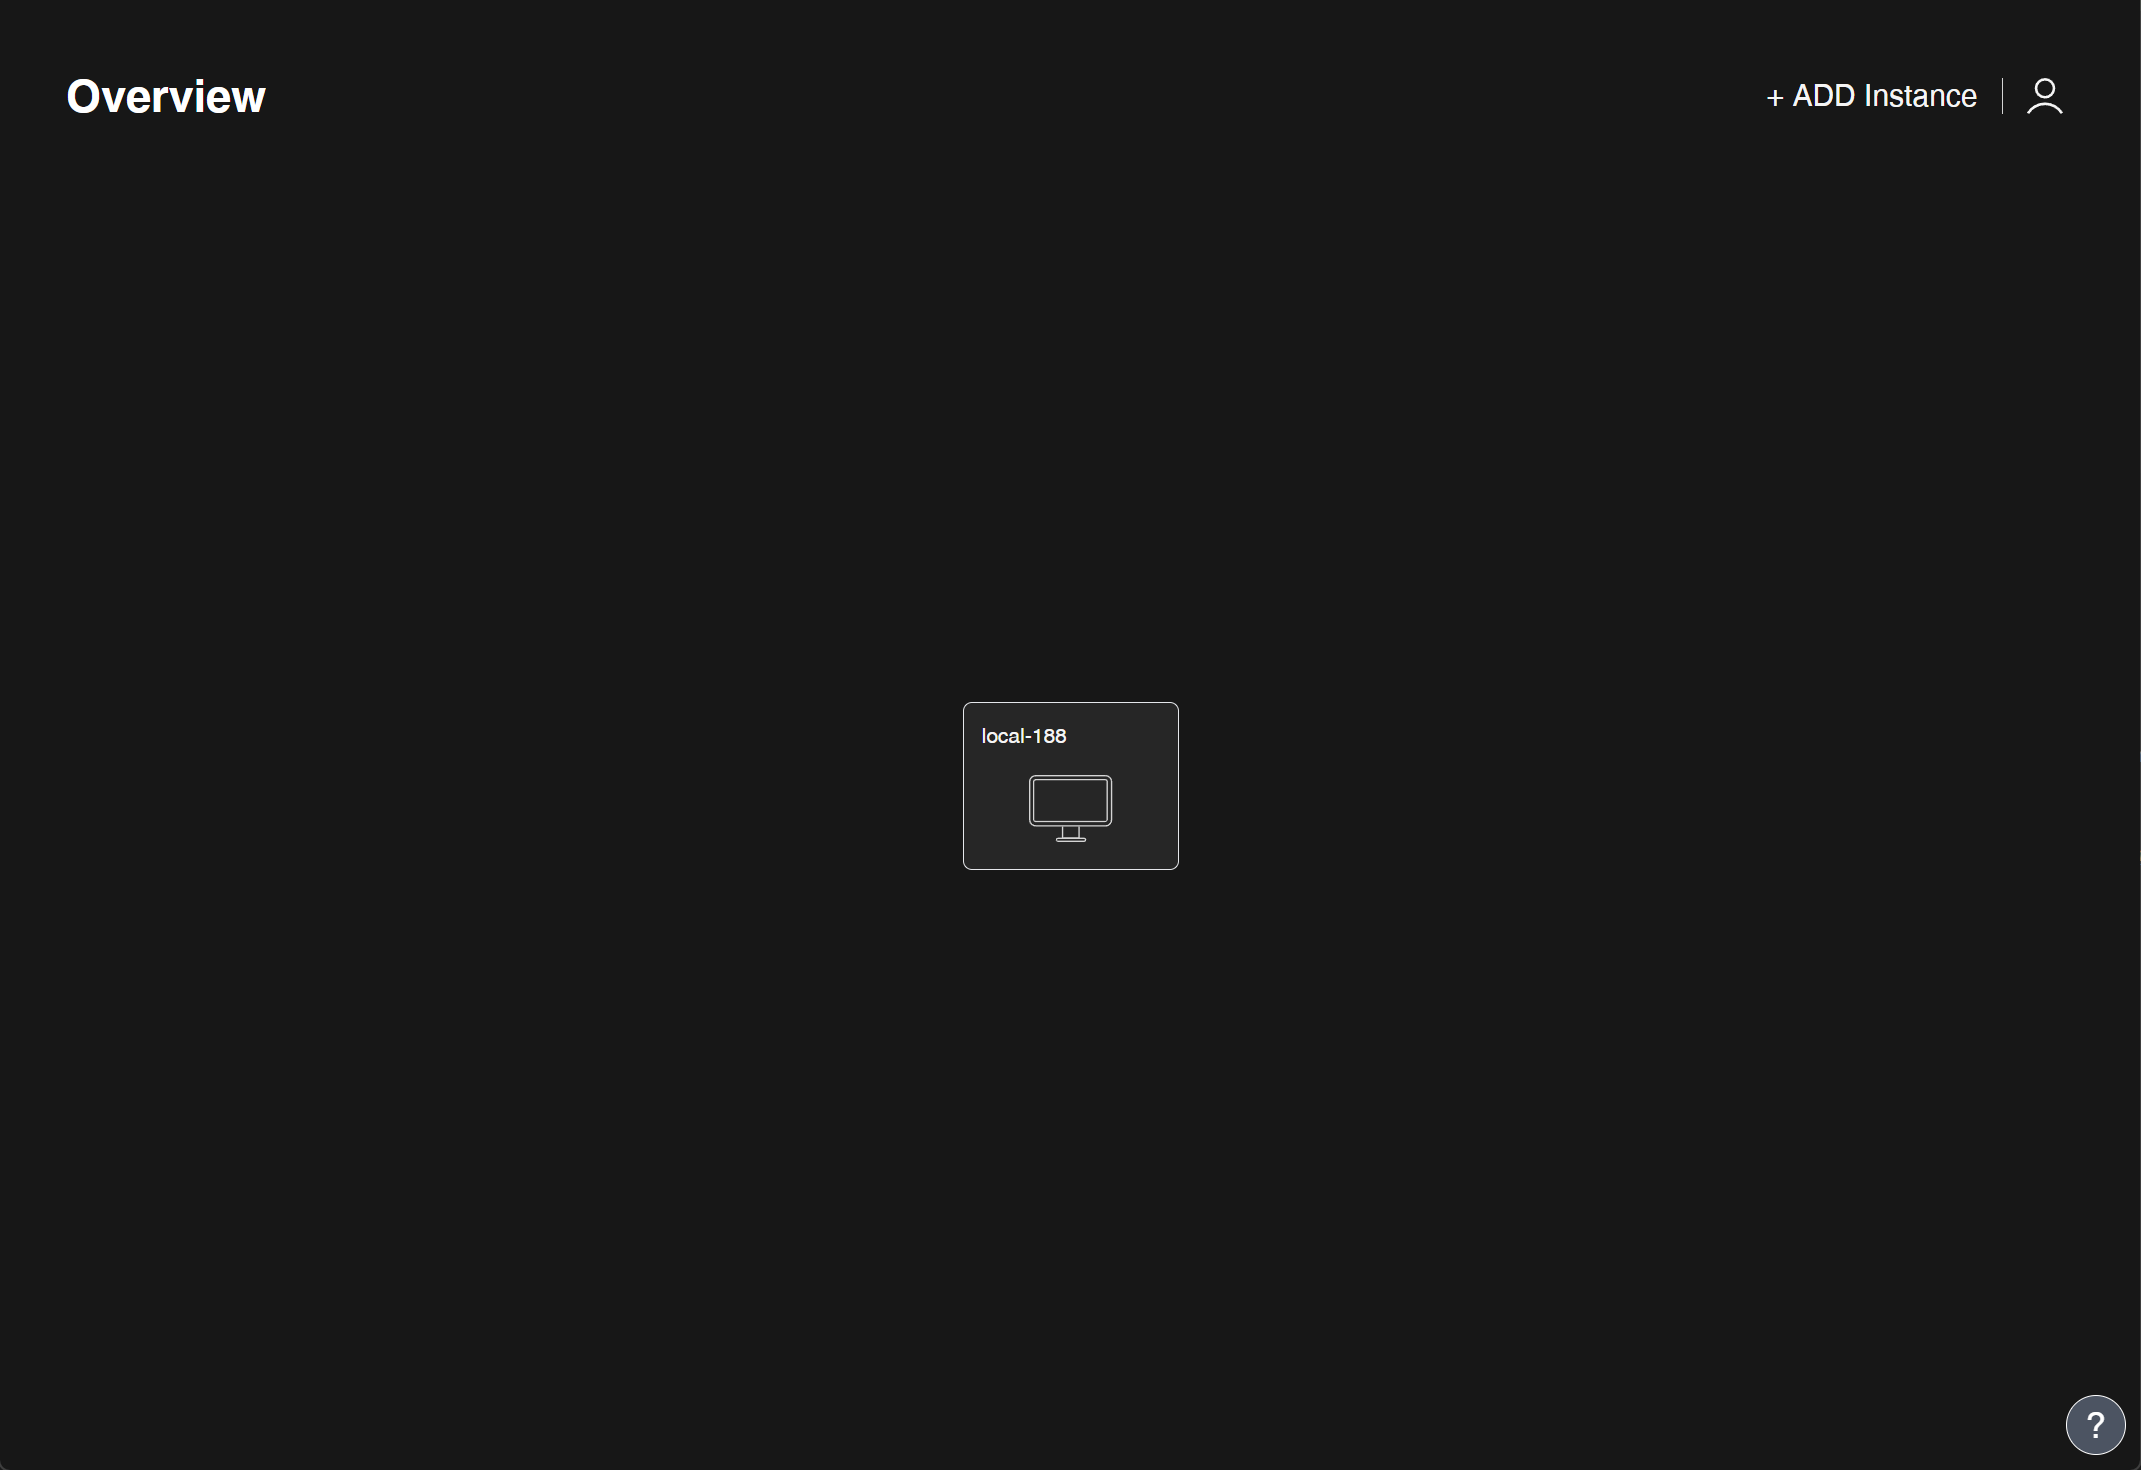
- Click on the tile which represents your device to access its microservices and configure it.
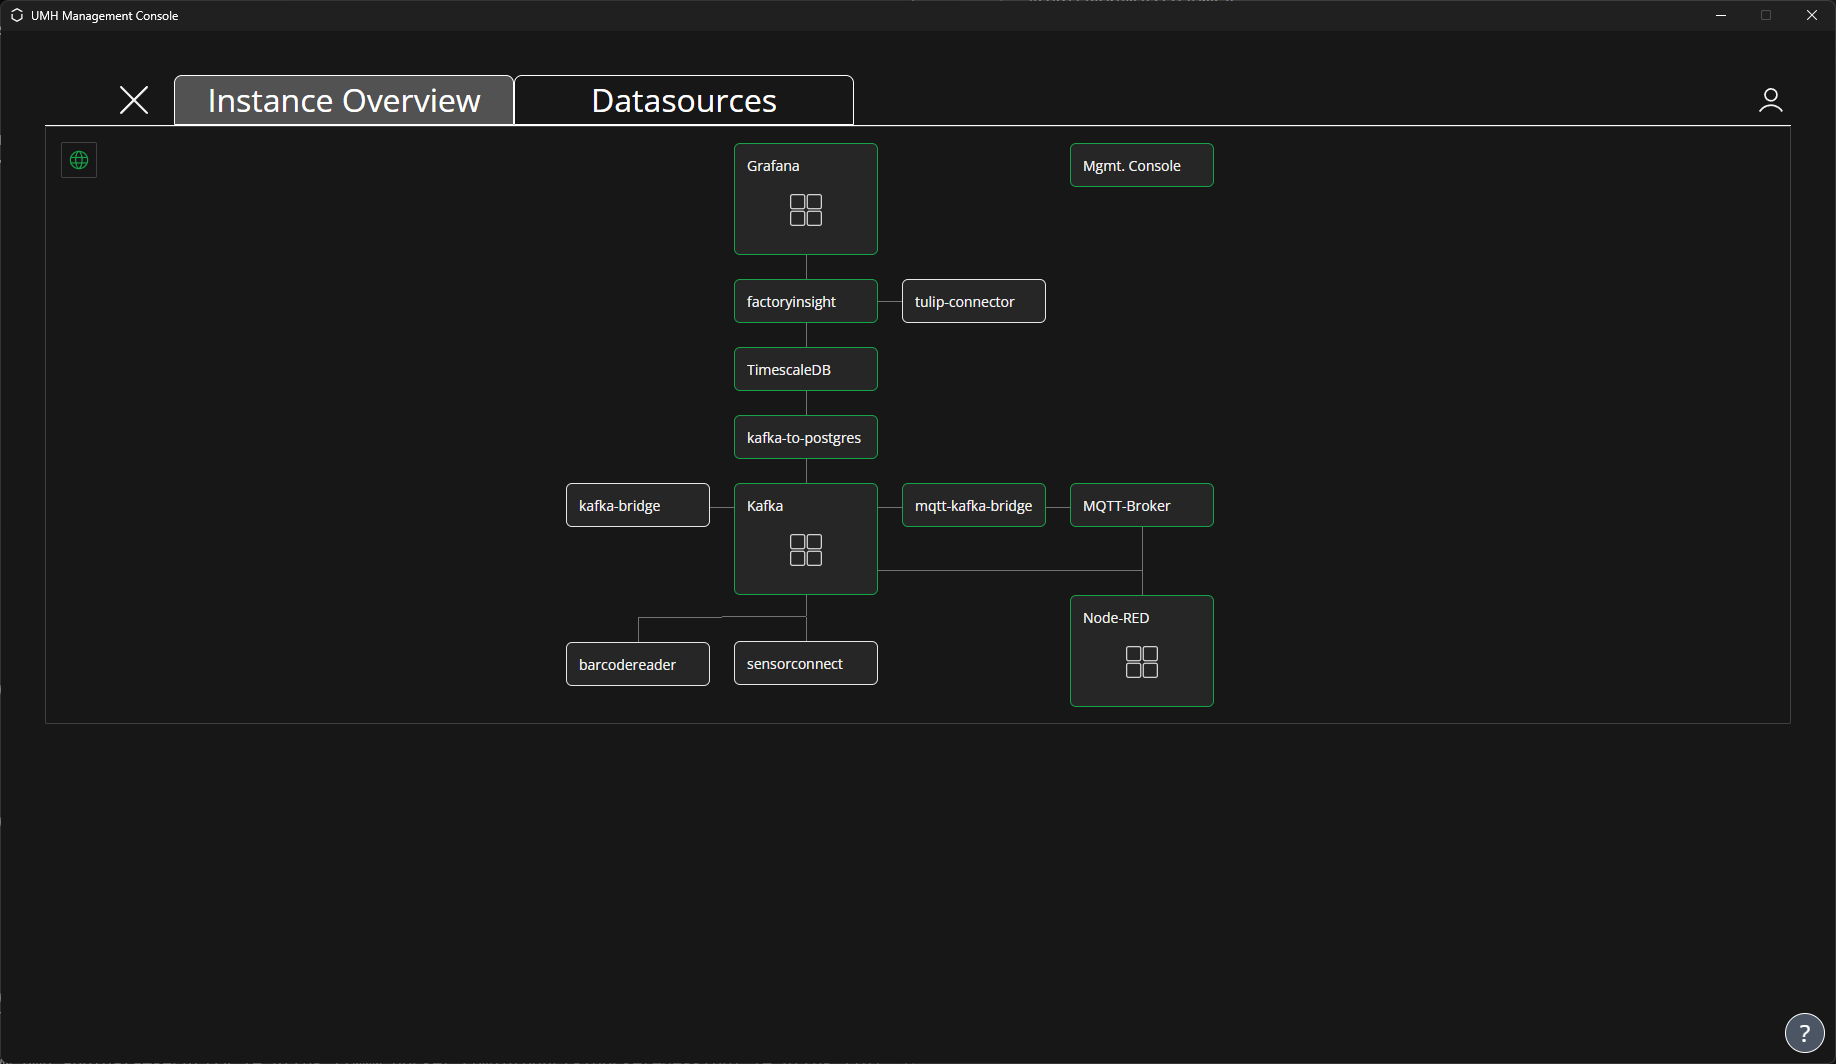
If you just created your local instance, please be aware that it may take a few minutes for all services to start, this is dependents on your system’s resources. Once they are started running, the color of their border changes from white or red to green.
- Once the Management Console looks like in the picture below, you can continue with the tutorial. The device tree displays the different microservices that make up the UMH instance.
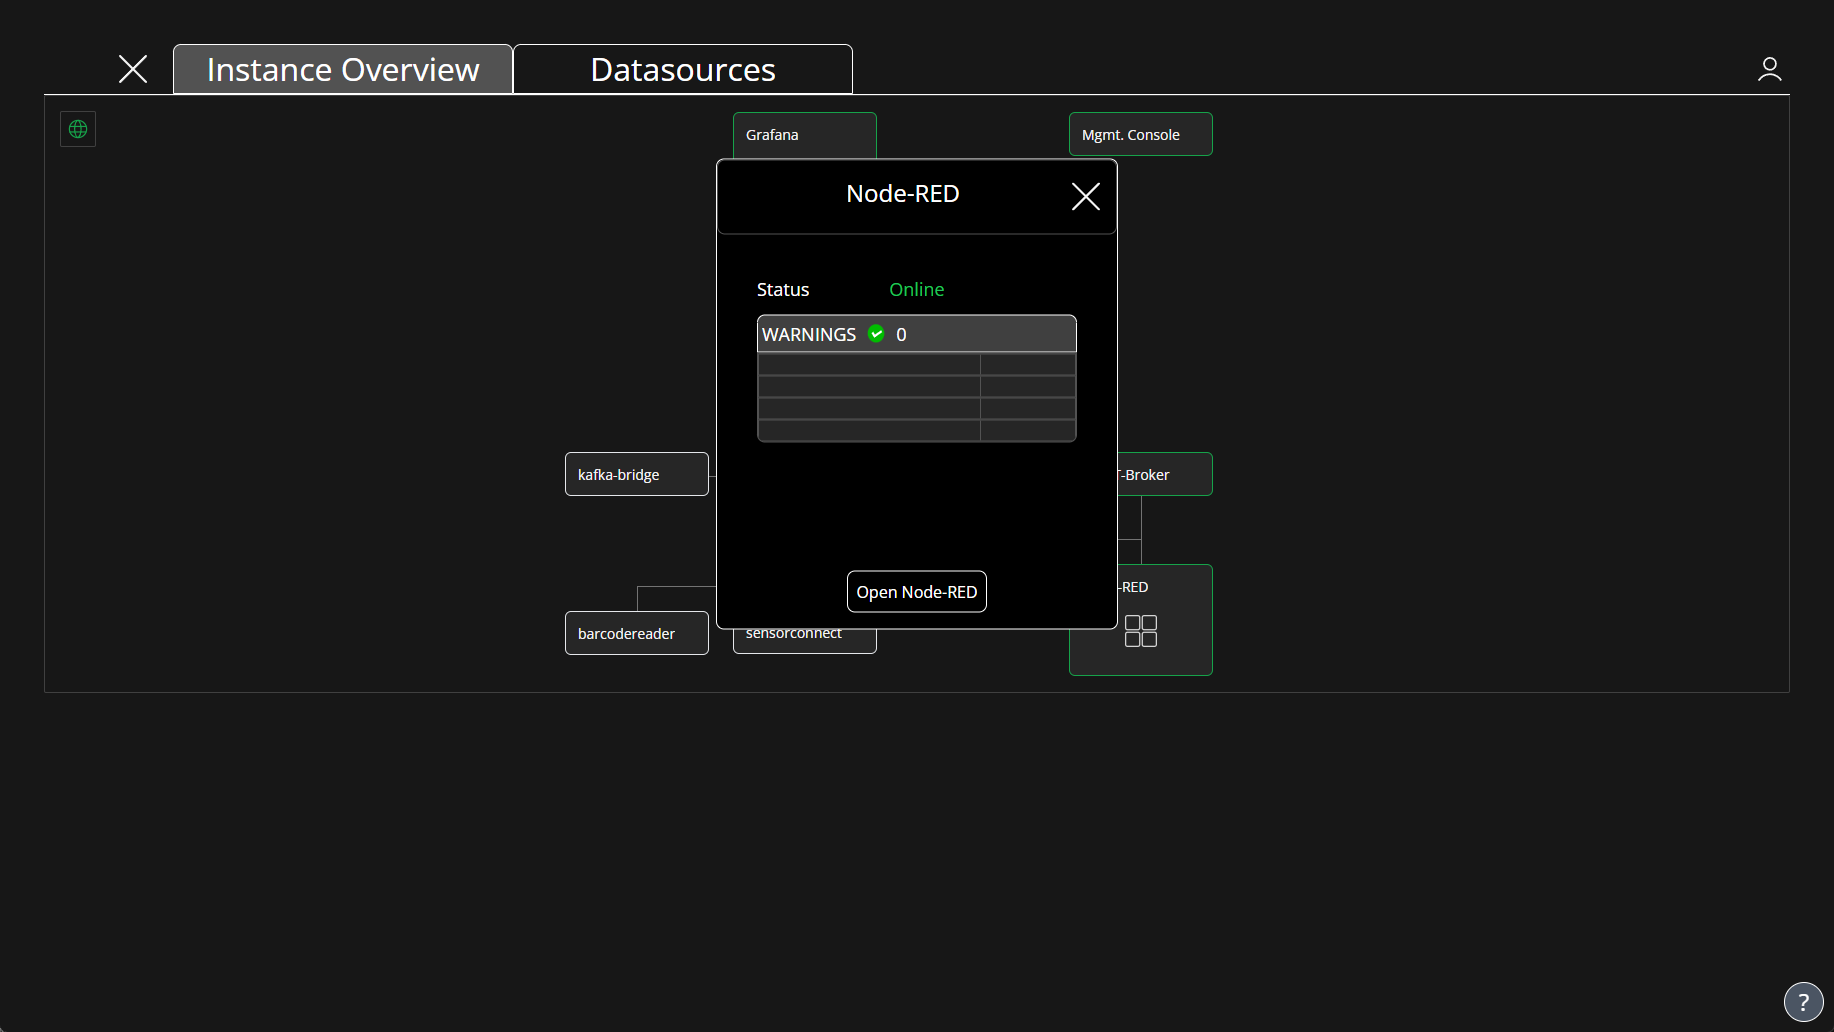
- Click on Node-RED to open the service popup. In the popups, you can see the status of the current service as well as warnings. To access the web interface of the service, if it features one, click on the Open button.
If you hover over the World icon, you can see when the last message from the instance was received.
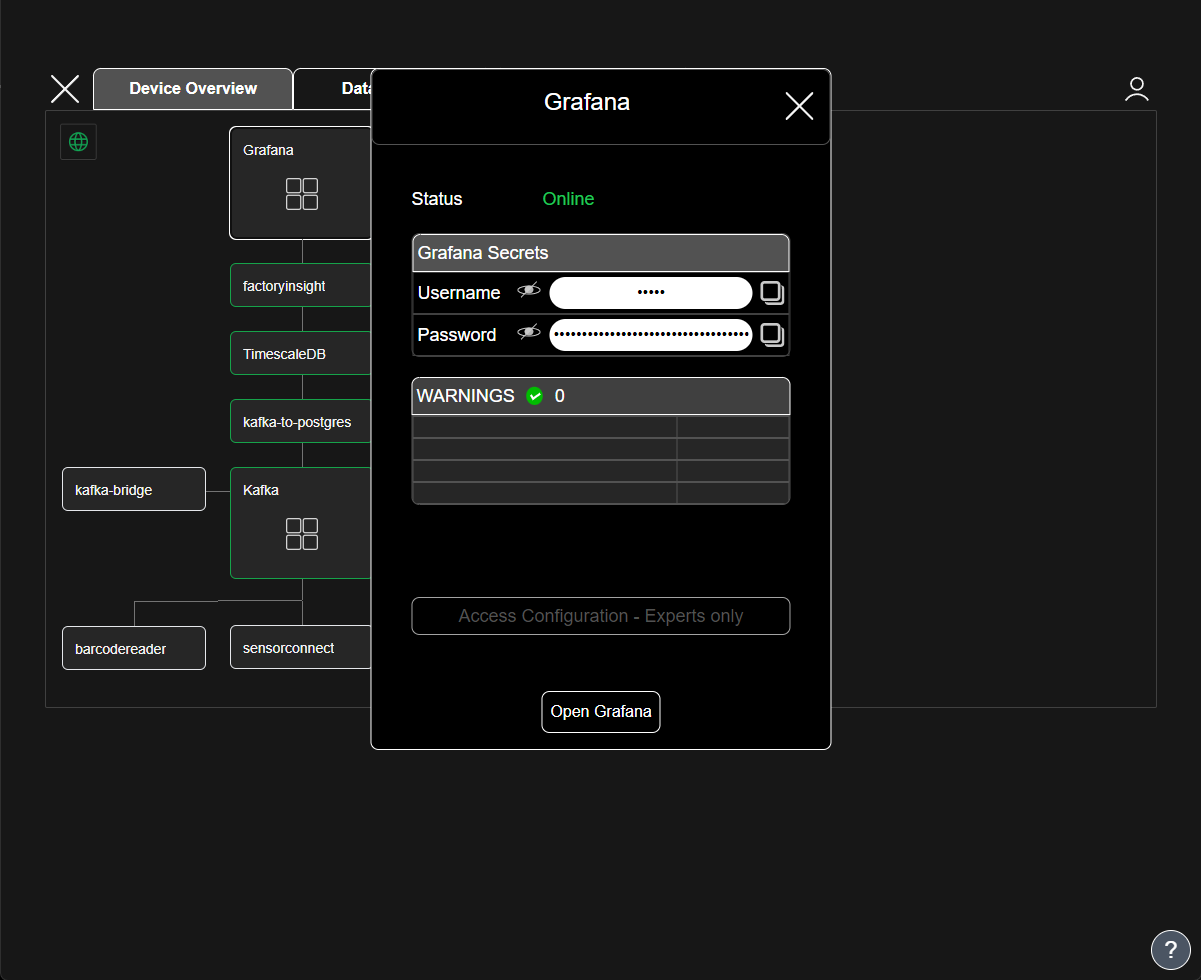
- Close the Node-RED popup and click on the Grafana service. Some popups, like this one, give additional information like the Username and Password to log in to the Grafana Web interface.
What’s Next
If you want to learn how to use the UMH and about the UMH data model, you can follow these tutorials in the UMH Documentation:


